StepStone Group (STEP)·Q3 2026 Earnings Summary
StepStone Q3 FY2026 Earnings: Beats on Revenue and EPS, Stock Drops 7.5%
February 5, 2026 · by Fintool AI Agent
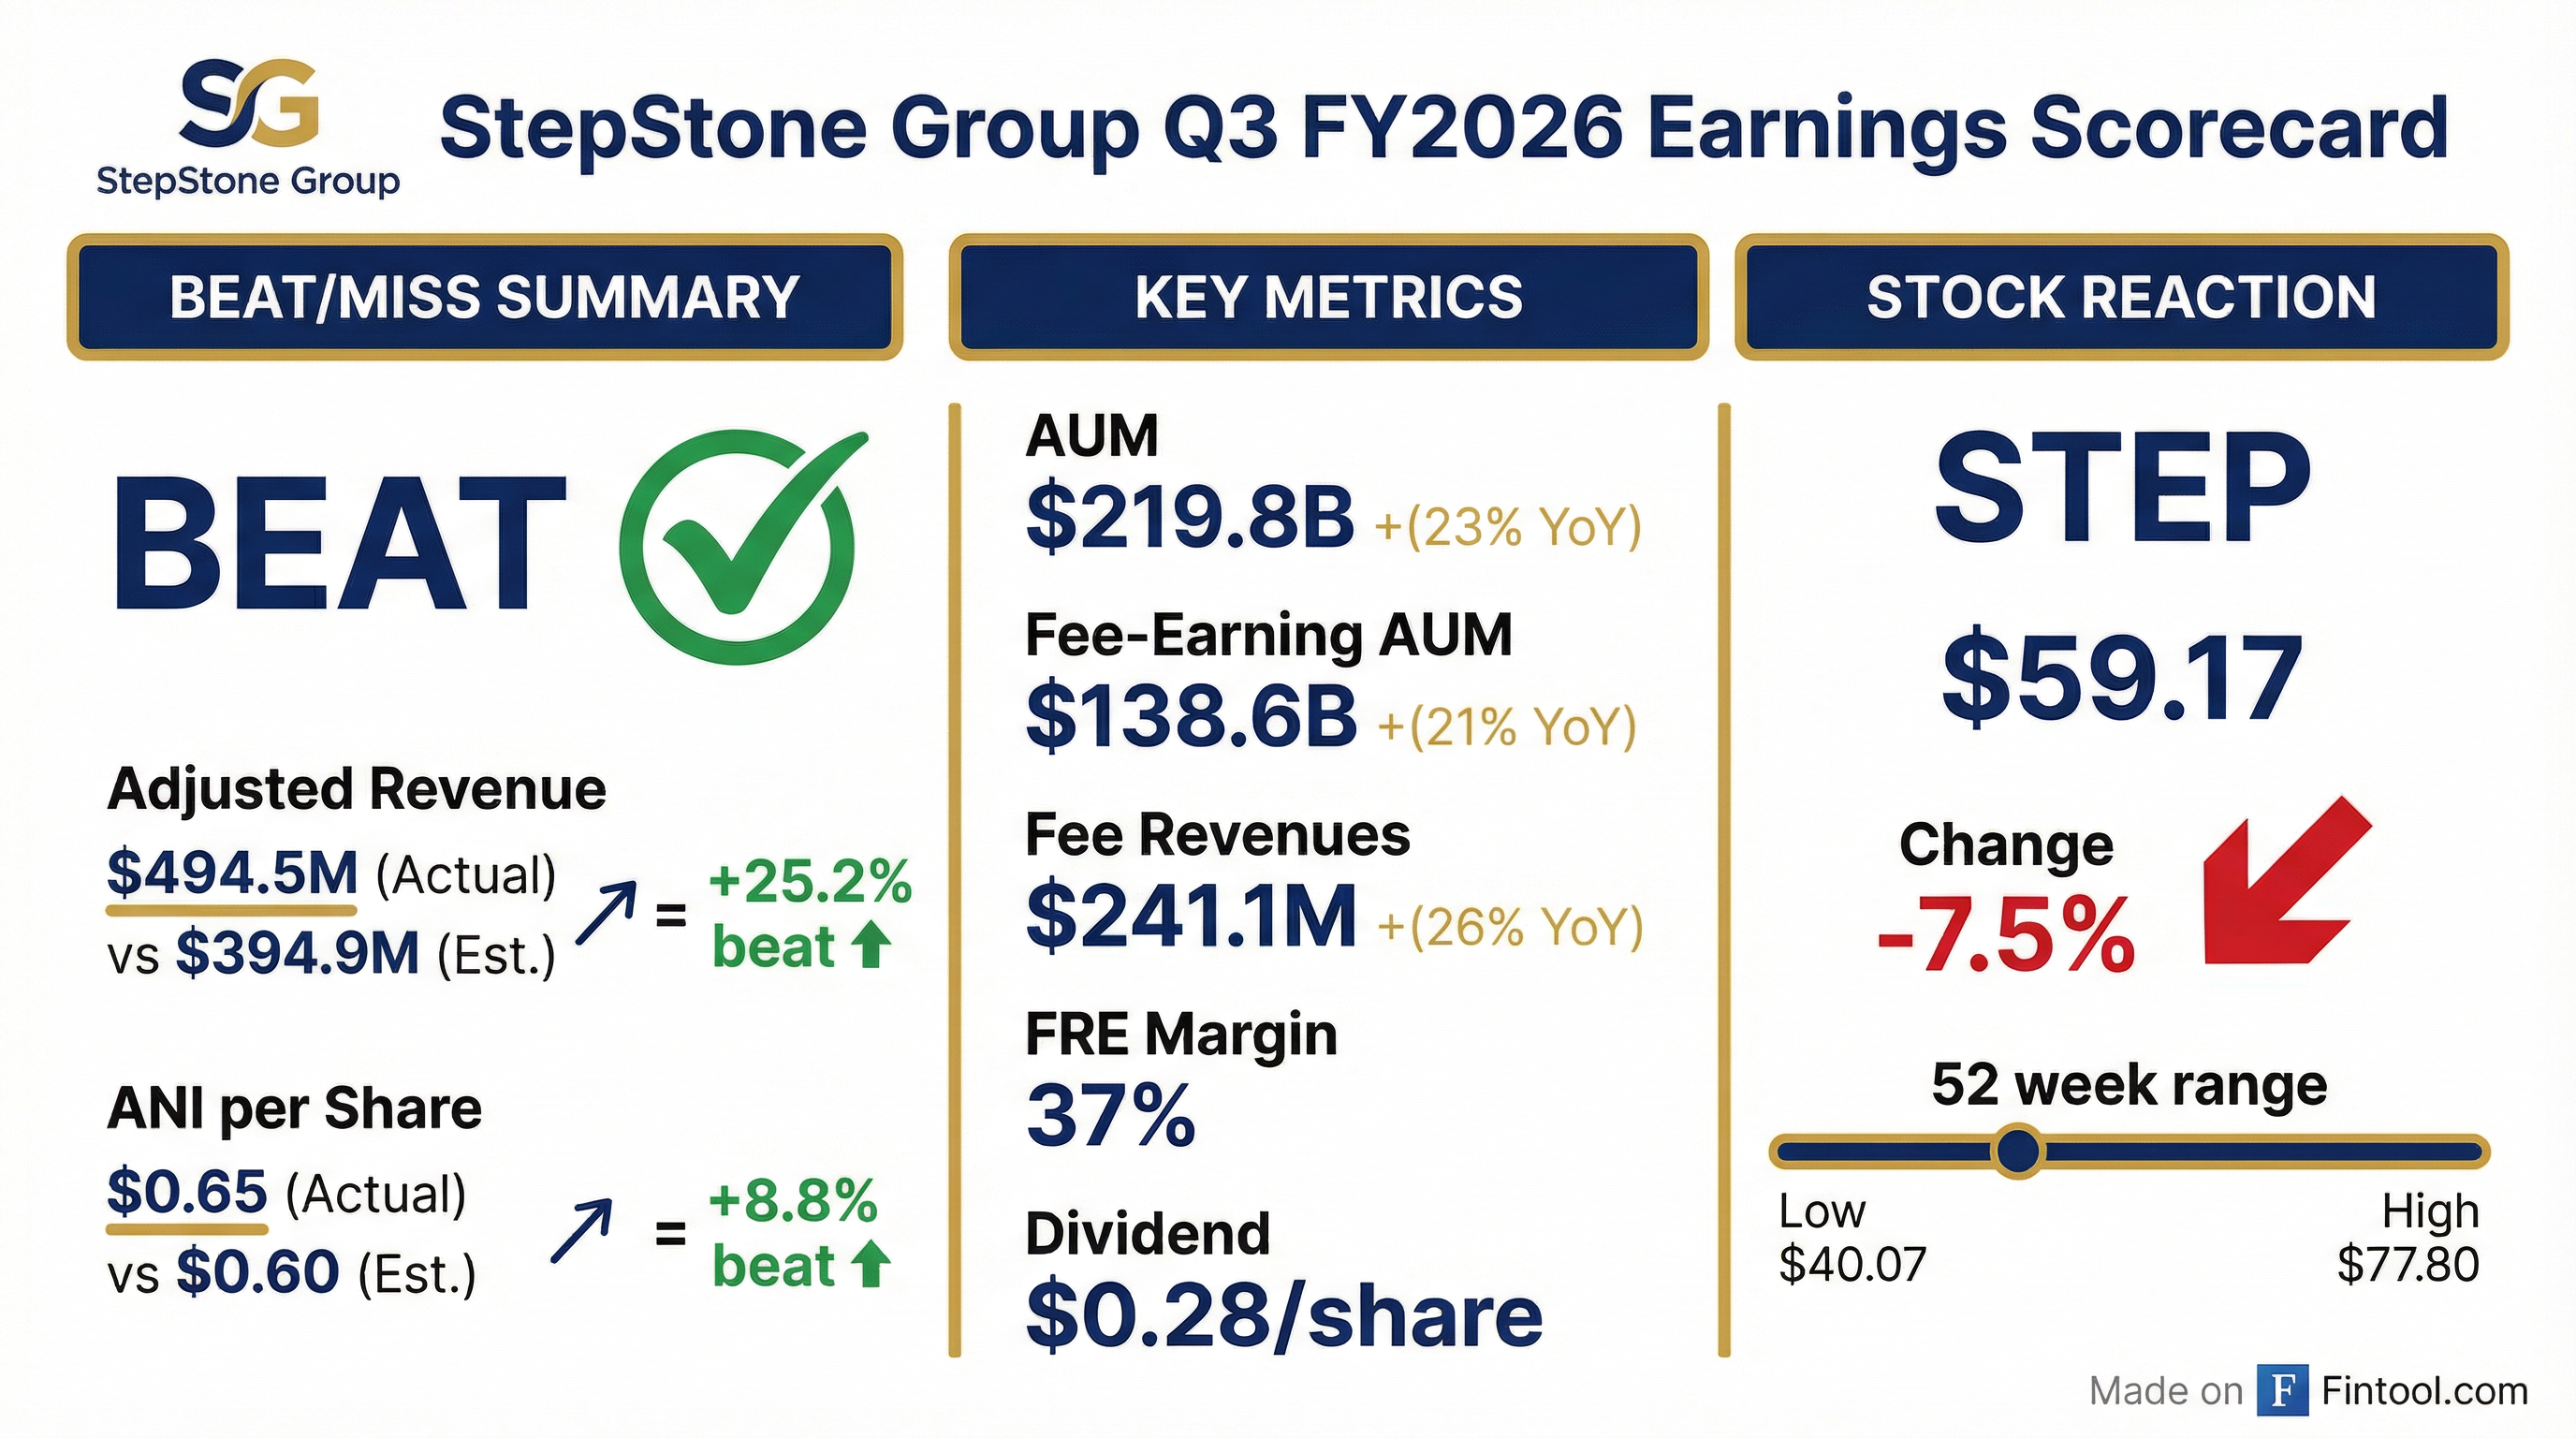
StepStone Group delivered a blowout Q3 FY2026, crushing adjusted revenue estimates by 25% and EPS by 9% — yet shares tumbled 7.5% to $59.17. The disconnect? A 387% YoY surge in gross realized performance fees made results appear unsustainable, while GAAP losses persisted due to heavy equity-based compensation. AUM hit $219.8B (+23% YoY) and the dividend increased to $0.28/share.
Did StepStone Beat Earnings?
Yes — decisively on both metrics.
The massive revenue beat was driven by $253.4M in gross realized performance fees — up 387% YoY from $52.1M in Q3 FY25. This included $207.9M in incentive fees from a single quarter, compared to just $22.4M a year ago.
However, GAAP results remain in the red:
The ongoing GAAP losses are driven by equity-based compensation of nearly $469M this quarter, masking strong underlying economics.
What Are StepStone's Key Operating Metrics?
Assets Under Management
StepStone continues its strong growth trajectory across AUM metrics:
The 51% growth in undeployed fee-earning capital signals significant dry powder for future deployment.
Fee-Earning AUM by Asset Class
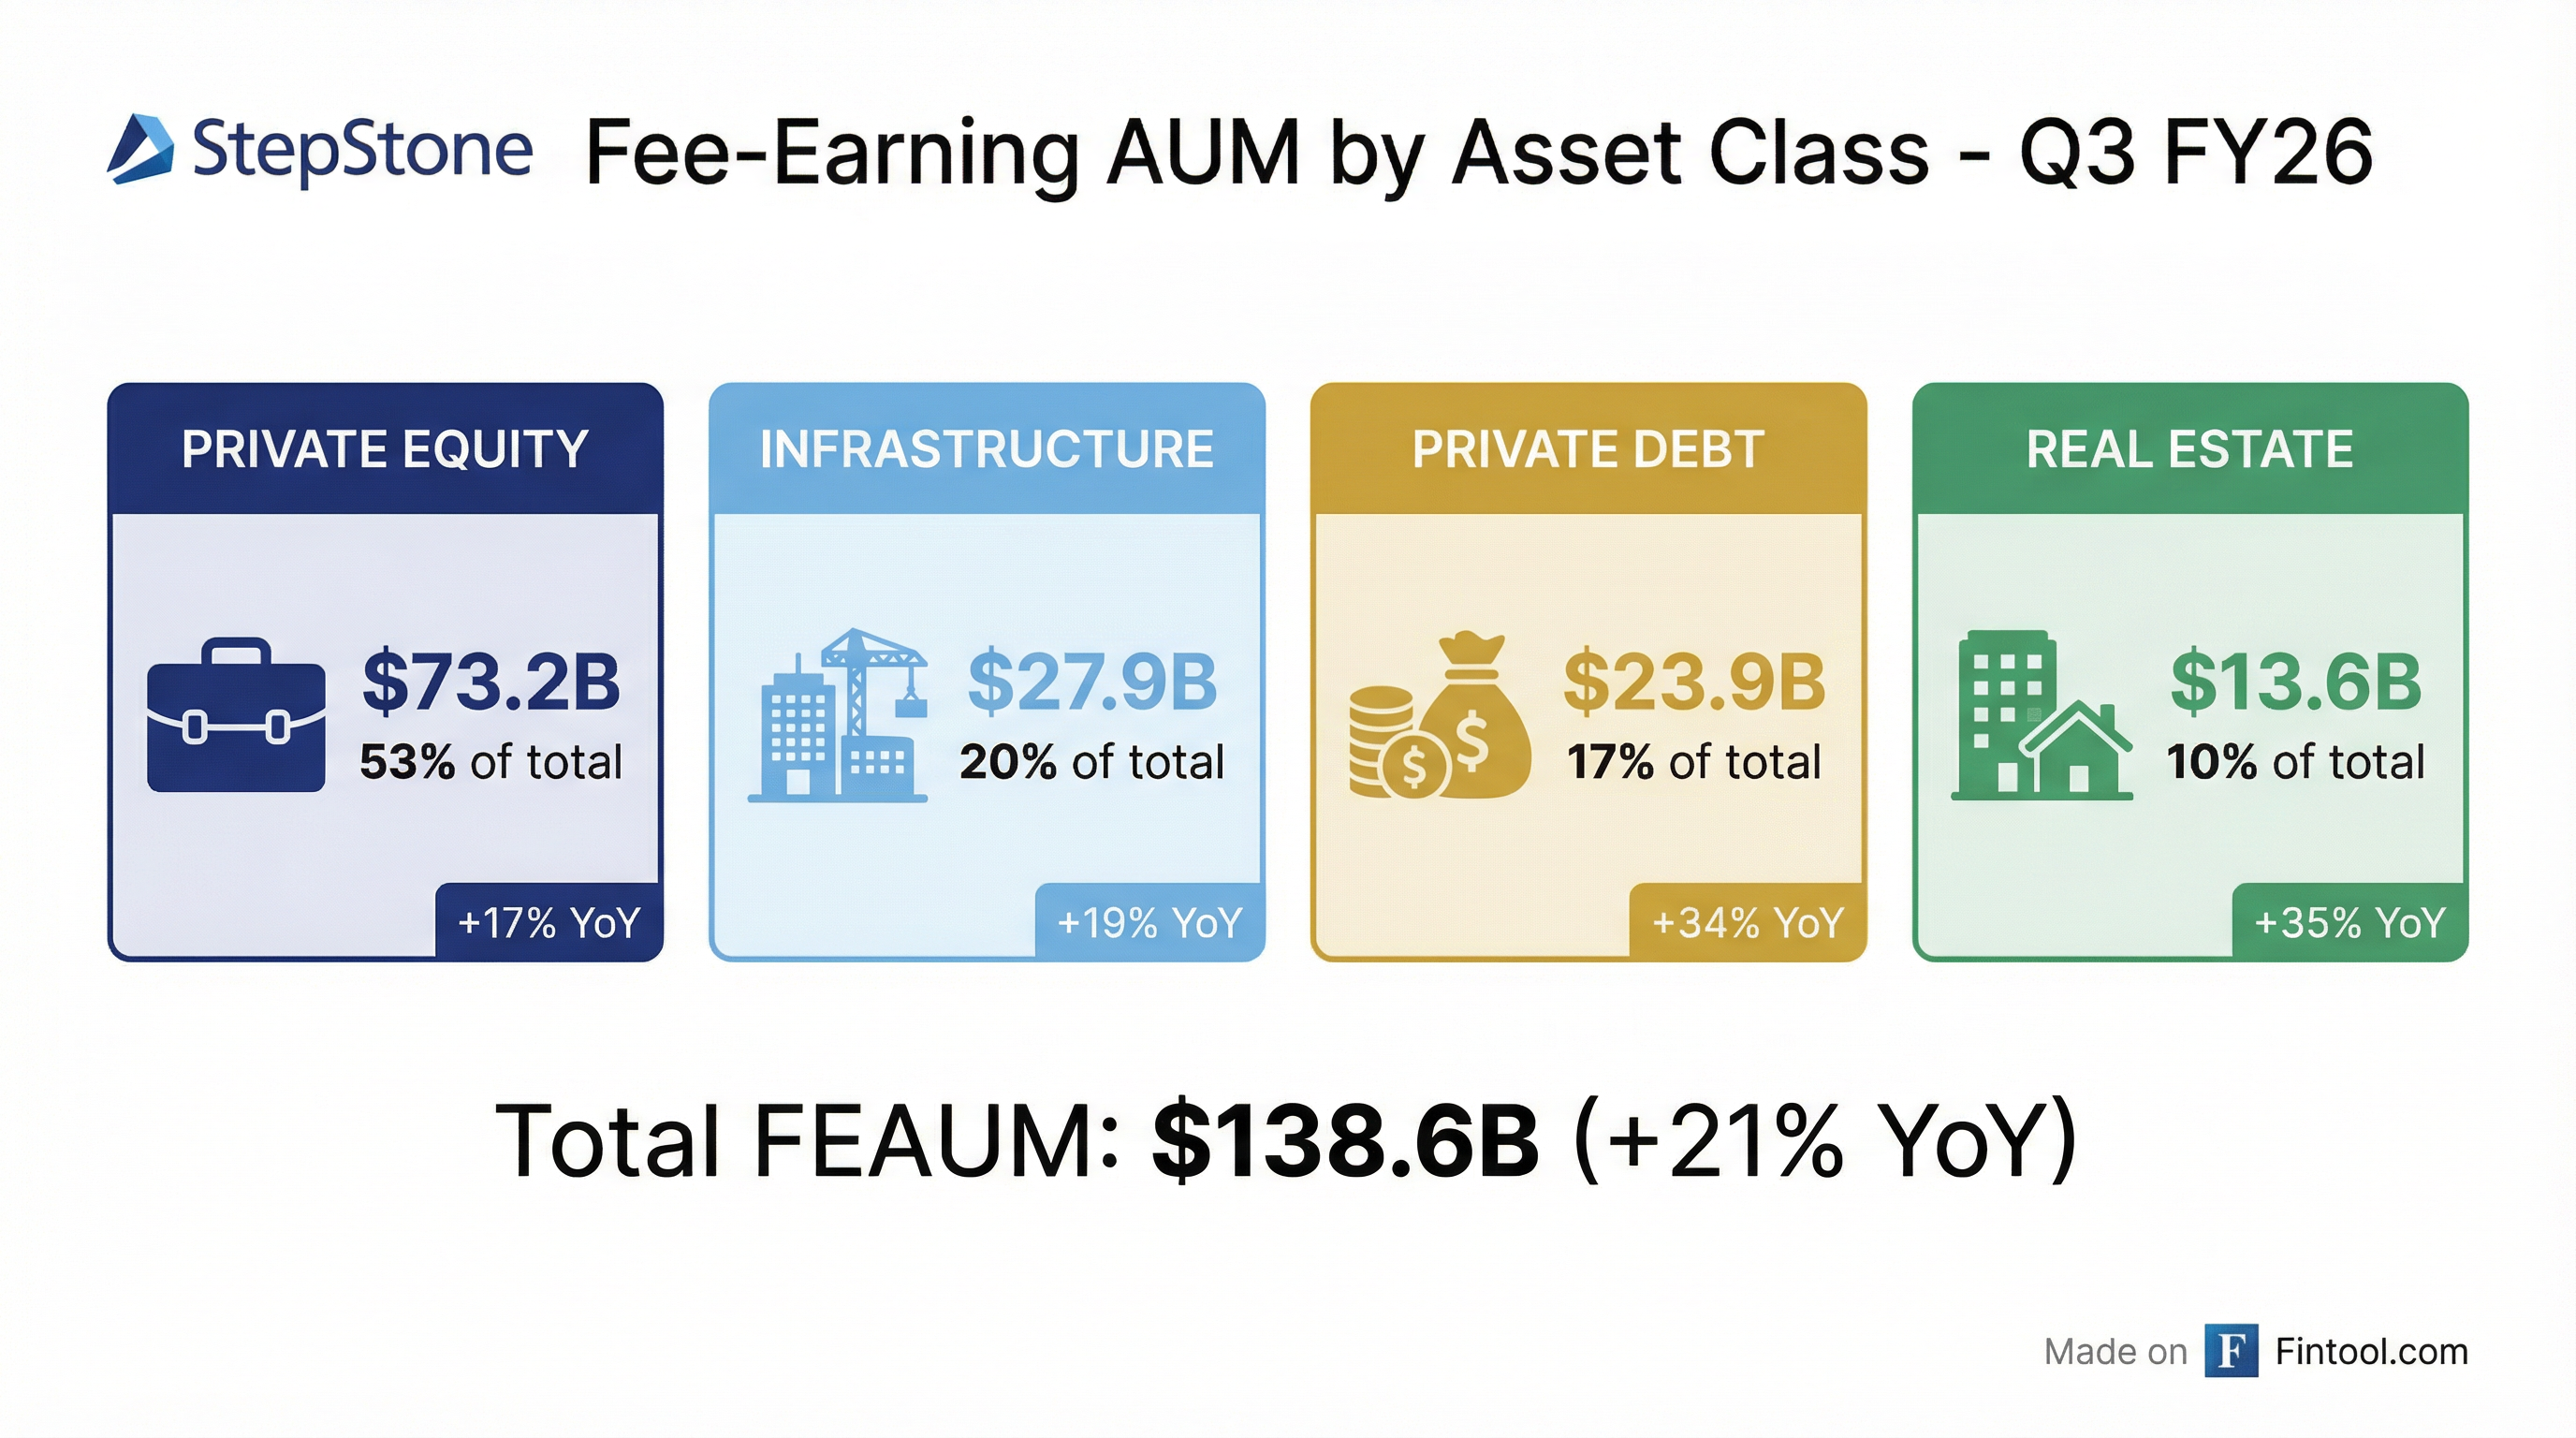
Private Debt and Real Estate are the fastest-growing segments, reflecting strong demand for alternative credit and StepStone's successful real estate secondaries fundraise.
Strategic Mix Shift
StepStone has strategically shifted toward higher-fee commingled funds:
This mix shift is a key driver of blended management fee expansion — commingled funds earn ~1.01% average fees vs ~0.38% for SMAs.
Q&A Highlights: Software Exposure and AI Disruption
The earnings call Q&A centered on a "topic du jour" — software exposure amid AI disruption concerns (likely referencing the DeepSeek developments). Management provided detailed risk assessment:
Software Exposure by Segment
"As investors, there's a lot that's outside of our control... The one thing that is always completely within our control is portfolio construction and diversification." — Scott Hart, CEO
Spring Fund: Why Returns Weren't Just Discount Markups
A key clarification: Only 3 percentage points of Spring's 39% return came from secondary discount markups — the remaining 36 points came from actual investment performance post-acquisition.
"That's what has driven the 39% performance... in a year where you saw public cloud software indices down close to 30% in some cases." — Scott Hart, CEO
Spring's portfolio is positioned defensively within venture:
- Pure-play AI opportunities and AI infrastructure
- Specialized vertical software players
- Cybersecurity and defense tech
- Physical AI investments
The fund's 64% secondary allocation is primarily direct secondaries (acquiring stakes in individual companies), not traditional LP secondaries at deep discounts.
Private Credit: Bucking Industry Trends
Despite industry headlines about private wealth redemptions, StepStone hasn't experienced the same pressures:
"In our case, we are... a bit earlier in building out the syndicate for funds like CredEx. And so we have not seen maybe the pickup in redemptions that have been talked about across the industry." — Scott Hart, CEO
Sub-1% position limits across evergreen vehicles provide additional diversification.
What Drove Fee Revenues?
Fee revenues reached $241.1M, up 26% YoY, with strong contributions across all channels:
The commingled fund growth reflects successful fundraising across private equity secondaries, real estate secondaries, and infrastructure strategies.
How Did the Stock React?
Despite the strong beat, STEP fell 7.5% to $59.17 on February 5, 2026.
The likely culprits for the sell-off:
- Lumpy performance fees: The 387% surge in realized performance fees may be viewed as non-recurring
- Continued GAAP losses: Net loss of -$162.4M despite strong adjusted earnings
- High expectations: Stock had rallied from ~$40 to ~$64 over the past year, pricing in strong growth
Analyst targets remain bullish at $80.29 average (range: $66-$105), implying 36% upside from current levels.
What Changed From Last Quarter?
Key sequential changes from Q2 FY26 to Q3 FY26:
The standout is the $188.5M sequential increase in gross realized performance fees, driven by strong realization activity in the December quarter.
Accrued Carry and Investment Position
StepStone's unrealized carry balance represents significant future earnings potential:
Net Unrealized Carry by Vintage:
- Post-2020: 65% (higher quality, longer runway)
- 2020: 9%
- 2018-2019: 13%
- 2017 & Prior: 13%
By Asset Class: Private Equity dominates at 83%, with Real Estate (13%) and Infrastructure (5%) comprising the remainder.
Over 225 programs currently have carry or incentive fee structures, with $105B+ in performance fee-eligible capital.
Capital Allocation and Dividend
StepStone raised its quarterly dividend by 17% to $0.28/share earlier in fiscal 2026, reflecting confidence in sustainable fee-related earnings growth. The dividend is payable March 13, 2026 to shareholders of record as of February 27, 2026.
Record Fundraising Momentum
StepStone delivered its best 12-month fundraising period ever with $34 billion in gross AUM additions:
Geographic Diversification
Roughly two-thirds of inflows came from outside North America — a key competitive advantage:
"Our international fundraising is particularly strong among institutions, where we continue to benefit from an extended runway as these LPs continue to grow their allocations to private markets." — Mike McCabe, Head of Strategy
Managed Account Quality
Strong retention and expansion metrics:
- Retention rate: Over 90%
- Reup growth: ~30% average increase
- New/expanded accounts: ~$10B (50% of managed account additions) — best year ever
Private Wealth Growth
The Private Wealth platform continues to scale rapidly, reaching approximately $15.0 billion in AUM as of December 2025:
- Quarterly subscriptions: $2.2B+ — now consistently generating $2B+ per quarter
- Distribution partners: Expanded to 550+ platforms
- Cross-selling: 50% of partners selling 2+ products
"We are comfortably generating more than $2 billion in private wealth subscriptions each quarter. With five fund families in market and with an increasing effort internationally, we believe we have the balance, brand recognition, and track record to continue to grow off this base." — Scott Hart, CEO
Beat/Miss History
StepStone has a strong track record of beating estimates:
Beat rate: 6 of 8 quarters (75%)
AI Positioning: Opportunity and Risk
Management highlighted StepStone's positioning across the AI value chain:
"As a leading investor in the innovation economy, we are backing category-defining companies across the AI ecosystem, from native AI platforms to the hardware companies building the compute and storage that power these tools to software companies with proprietary data that enable differentiated high-value outputs." — Scott Hart, CEO
Cross-asset class AI exposure:
- Infrastructure/Real Estate: Data centers, power generation investments
- Private Debt: AI infrastructure financing
- Venture/Growth: Native AI platforms, vertical software, defense tech
"While we anticipate AI will be a huge creator of value, it will undoubtedly be disruptive, creating winners and losers... Given our highly diversified approach to private markets investing, our track record of partnering with top managers, and our data-driven insights, we expect to be well-positioned on both a relative and absolute basis." — Scott Hart, CEO
Forward Catalysts
Strong fund pipeline for calendar 2026:
Prior vintages of these funds represented $16B+ of capital, with management targeting "modest growth" across each.
Other key events to watch:
- Q4 FY26 earnings (May 2026) — will performance fee momentum continue?
- FTSE Russell partnership — private asset indices launch could expand addressable market
- Private wealth international expansion — building syndicate for StepX, CredEx, Strucks
- Supplemental dividend — Net PRE through 3 quarters already exceeds all of FY25
Client Quality and Concentration
StepStone serves a blue-chip institutional client base with strong retention characteristics:
The long account tenors (62% with >7 years remaining) provide significant fee visibility.
Key Risks
- Performance fee volatility: Q3's 387% surge may not repeat; realizations are lumpy
- Client concentration: Top 10 clients represent 77% of LTM fees
- GAAP losses persist: Equity-based compensation continues to weigh on reported earnings
- Fundraising environment: Industry-wide fundraising challenges noted by management
The Bottom Line
StepStone delivered a stellar Q3 FY26 with 25% revenue beat and strong operating momentum across all asset classes. However, the stock's 7.5% decline reflects investor skepticism about the sustainability of the massive performance fee contribution. Core fee-related earnings grew 20% YoY with 37% margins, demonstrating durable underlying profitability.
With $219.8B in AUM, $32.7B in dry powder, and a rapidly scaling private wealth platform, StepStone remains well-positioned in the alternative asset management space. The key question for investors: can management translate AUM growth into consistent, predictable earnings without relying on lumpy performance fees?
Data as of February 5, 2026. All estimates from S&P Global. Stock prices from market data.
Related Resources: